
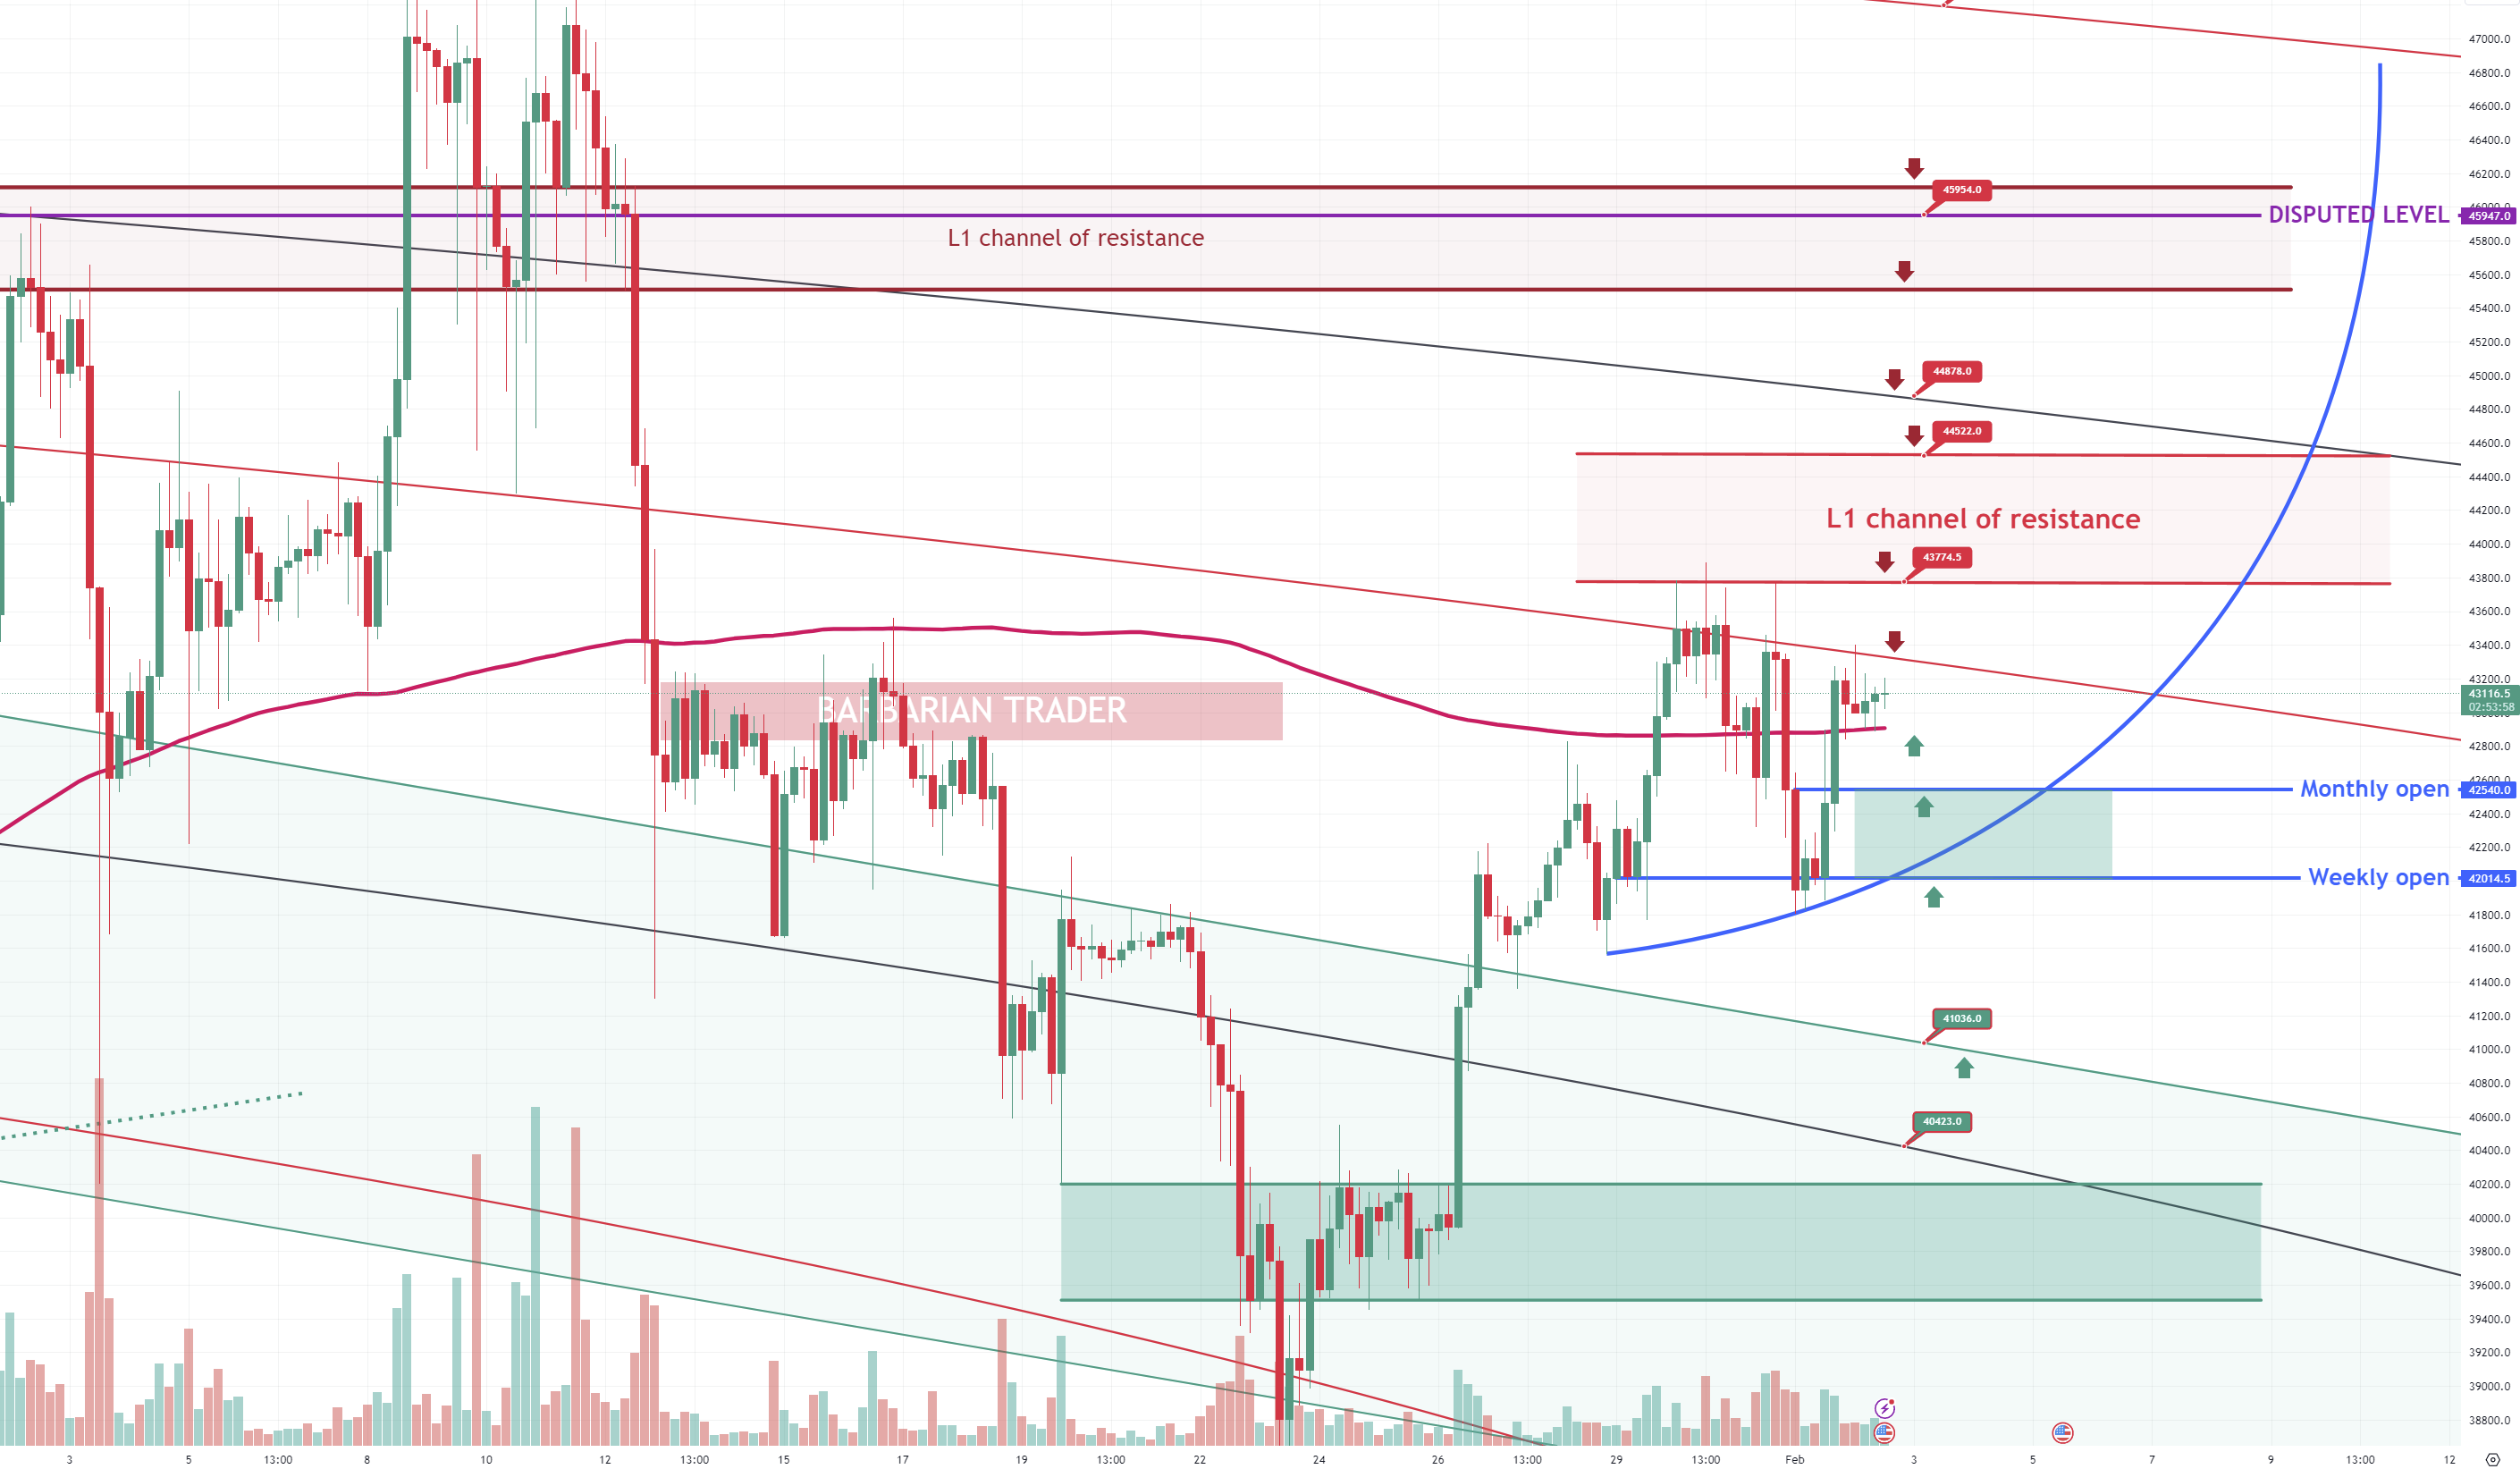
BTC 4h Bybit chart.
For the moment 4h is finding local support at the 200MA.
I marked with blue the possible parabolic move as long as BTC price meets the condition of holding Weekly open and Monthly open levels as support, preferably, in case of a sell move, the price should remain above Monthly open. The second condition is breaking and flipping in support of the 43770 level.
Usually, the bases of the parabolic moves are very volatile on both directions and are trading in a pretty flat horizontal channel until phase 2 begins which gets more and more volatile on the upper side.
Possible to see some choppiness along 4h 200MA.
Key levels of resistance for the moment are the red fib circle at 43325 and the lower H. resistance channel at 43775.
Key levels of support, Monthly open & Weekly open. Bellow, currently, 41050 and 40420 levels.
For now, the BTC trading range is 42000-43775 until will be broken in either direction.
For fast scalps, we should look for patterns MA´s from the lower time frames.
Note: Check your broker chart and see the price level difference. This is just my opinion and it is not meant to be a signal or financial advice. Trade safe and manage your risk.
I hope you enjoyed this article. Don't forget to follow me on Twitter, YouTube and Instagram.
JOIN our Discord VIP trading group and get access to a lot of LIVE TRADING CHARTS: https://www.patreon.com/barbariantrader