
BTC 4h Bybit chart UPDATE
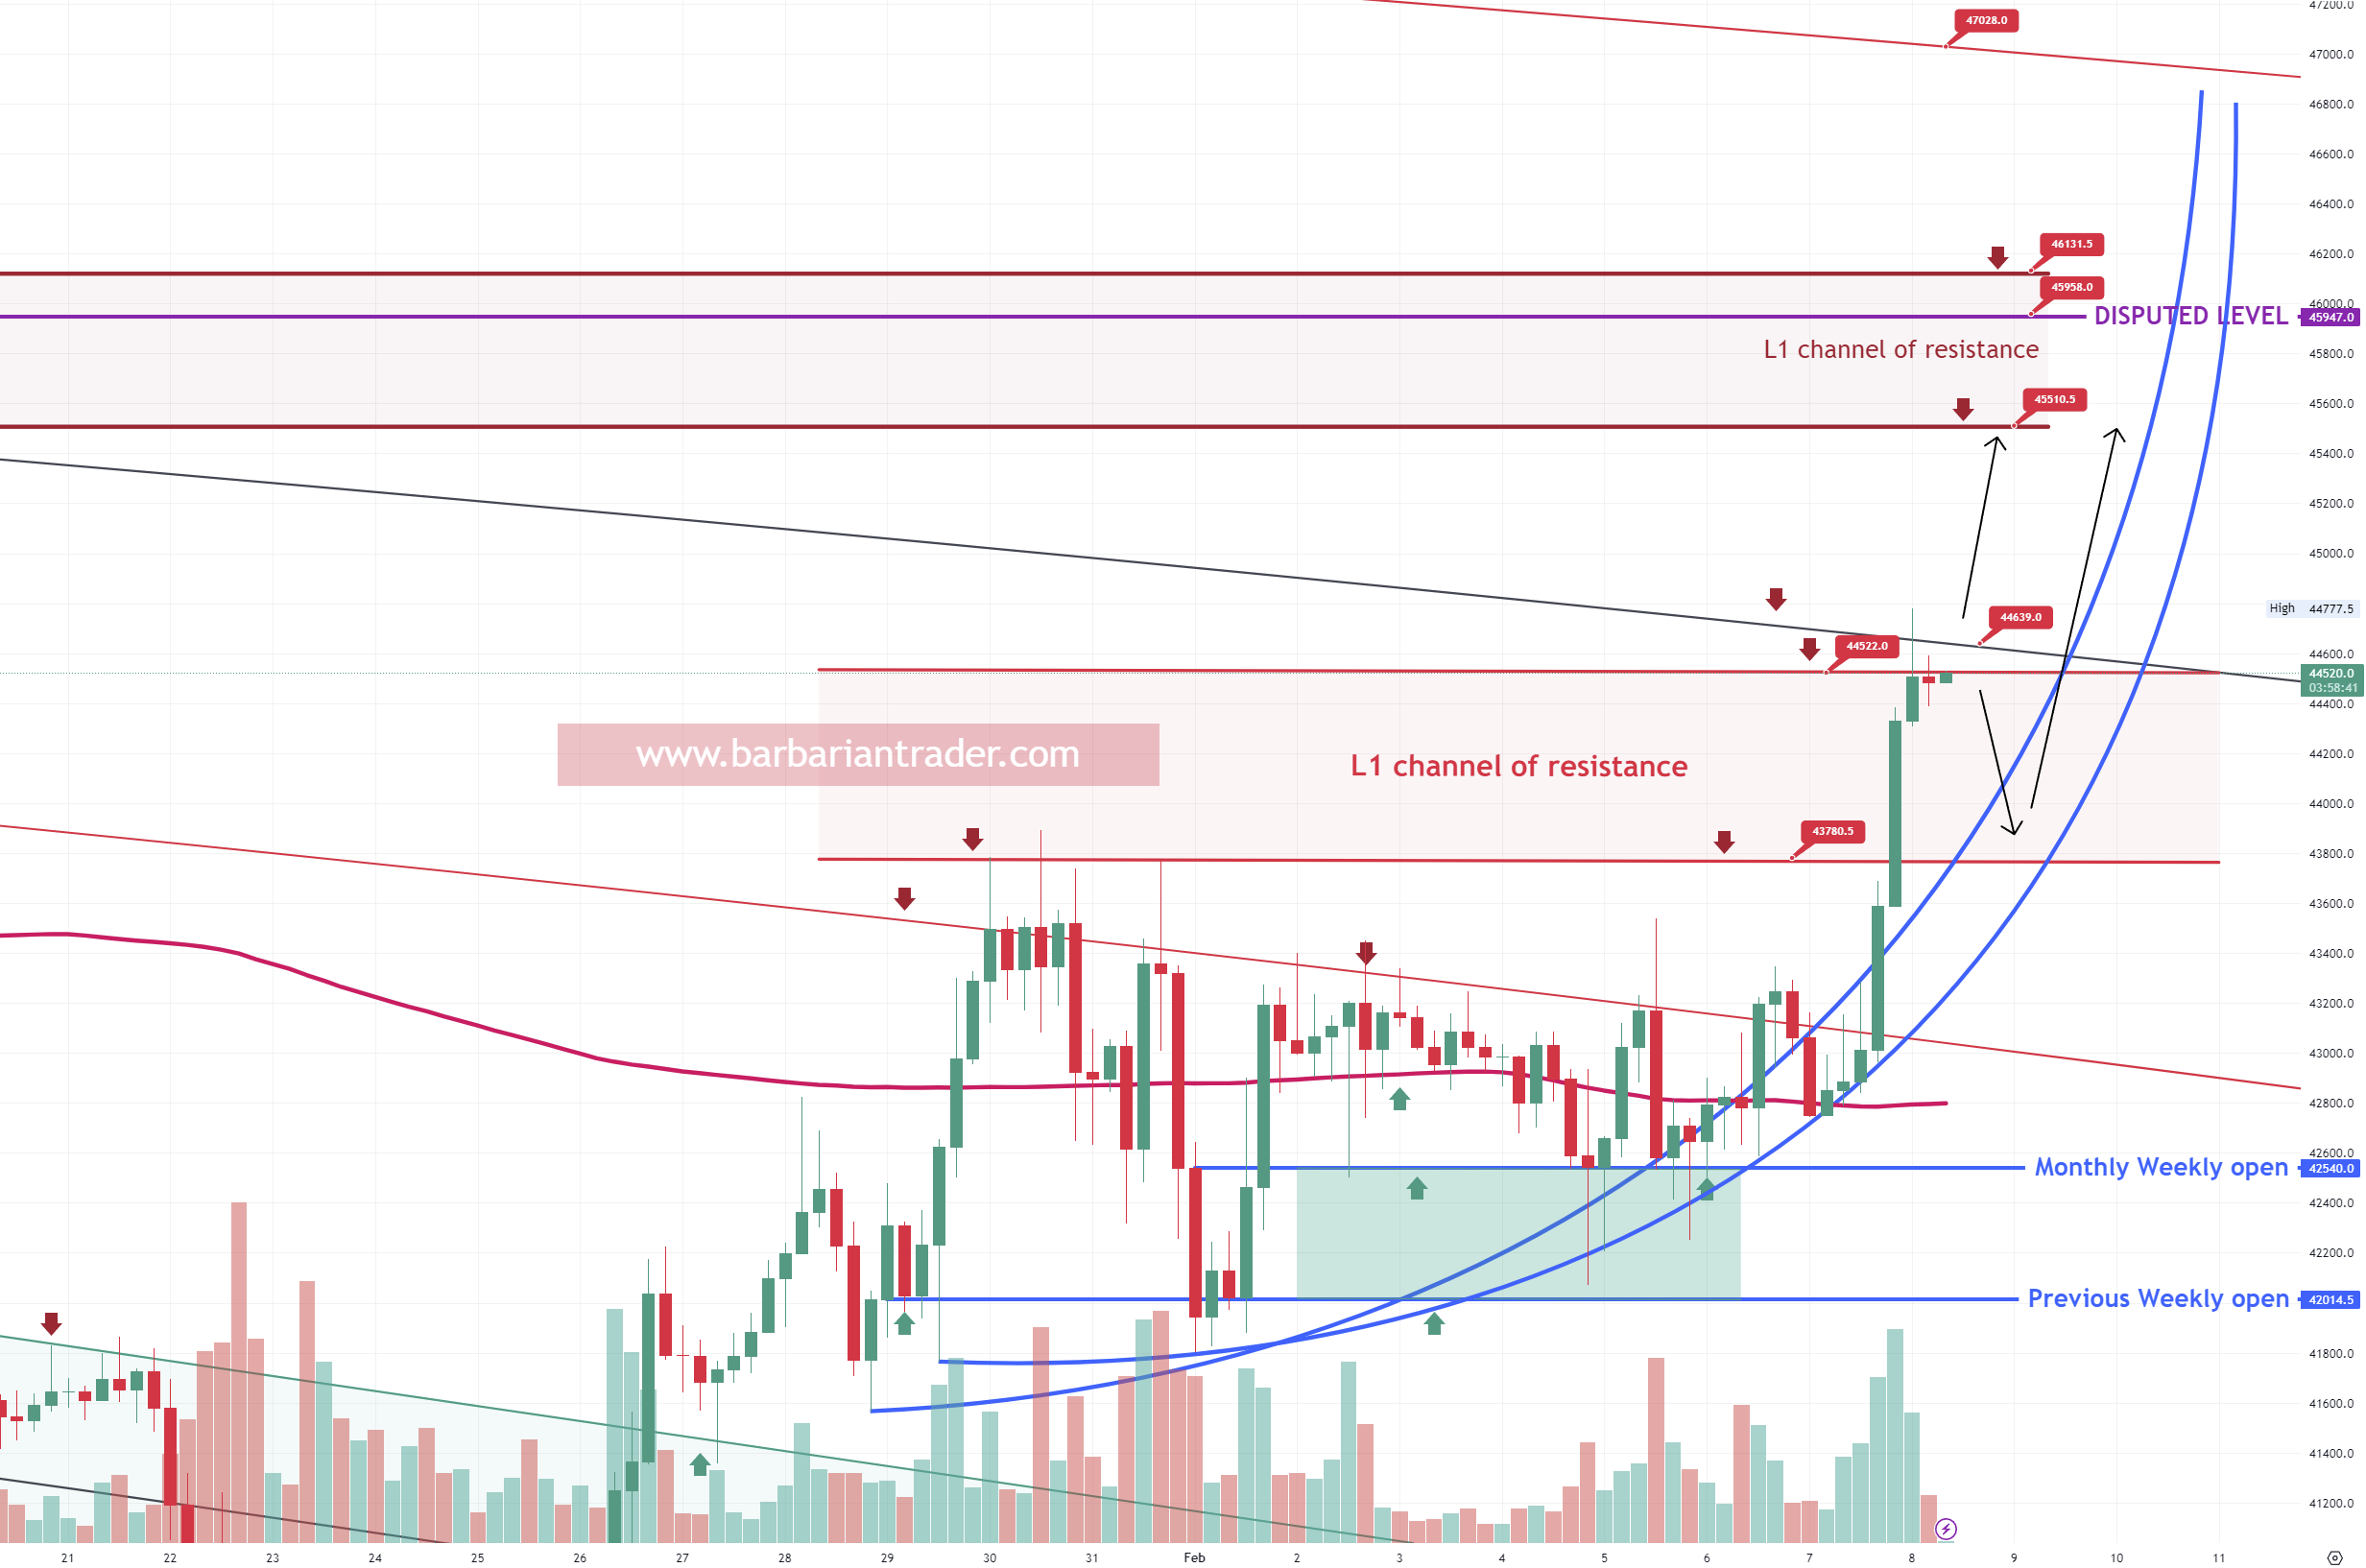
In the PREVIOUS ARTICLE, I discussed a possible base formation for a parabolic move. Now the Bitcoin price broke the resistance with a strong move up and it seems like the parabolic move is confirmed.
For now. the Bitcoin price hit the top of the first area of resistance and more exactly the top of the horizontal channel 44522 and the fib circle at 44660. There is a chance to see a correction in this area for a healthier continuation up. In case of a correction, I would like to see the previous local high of 43350-44000 acting as support.
If you want to have access to this live chart and more others and see in real-time the price action, you can subscribe to our Patreon group here: https://www.patreon.com/barbariantrader
The next strong level of resistance is at 45500-46130 with a possible spike up into the 46500-47100 area.
For a possible reload or jump in a long position, probably to wait for a correction from here might be a good idea and I will look for support/ demand zones for that.
From a technical perspective, BTC price might be in the middle of the parabolic move and we might see some fast corrections possibly followed by a strong buyback and a continuation up.
Trade safe and manage your risk.
Note: Check your broker chart and see the price level difference. This is just my opinion and it is not meant to be a signal or financial advice. Trade safe and manage your risk.
I hope you enjoyed this article. Don't forget to follow me on Twitter, YouTube and Instagram.
JOIN our Discord VIP trading group and get access to a lot of LIVE TRADING CHARTS: https://www.patreon.com/barbariantrader