
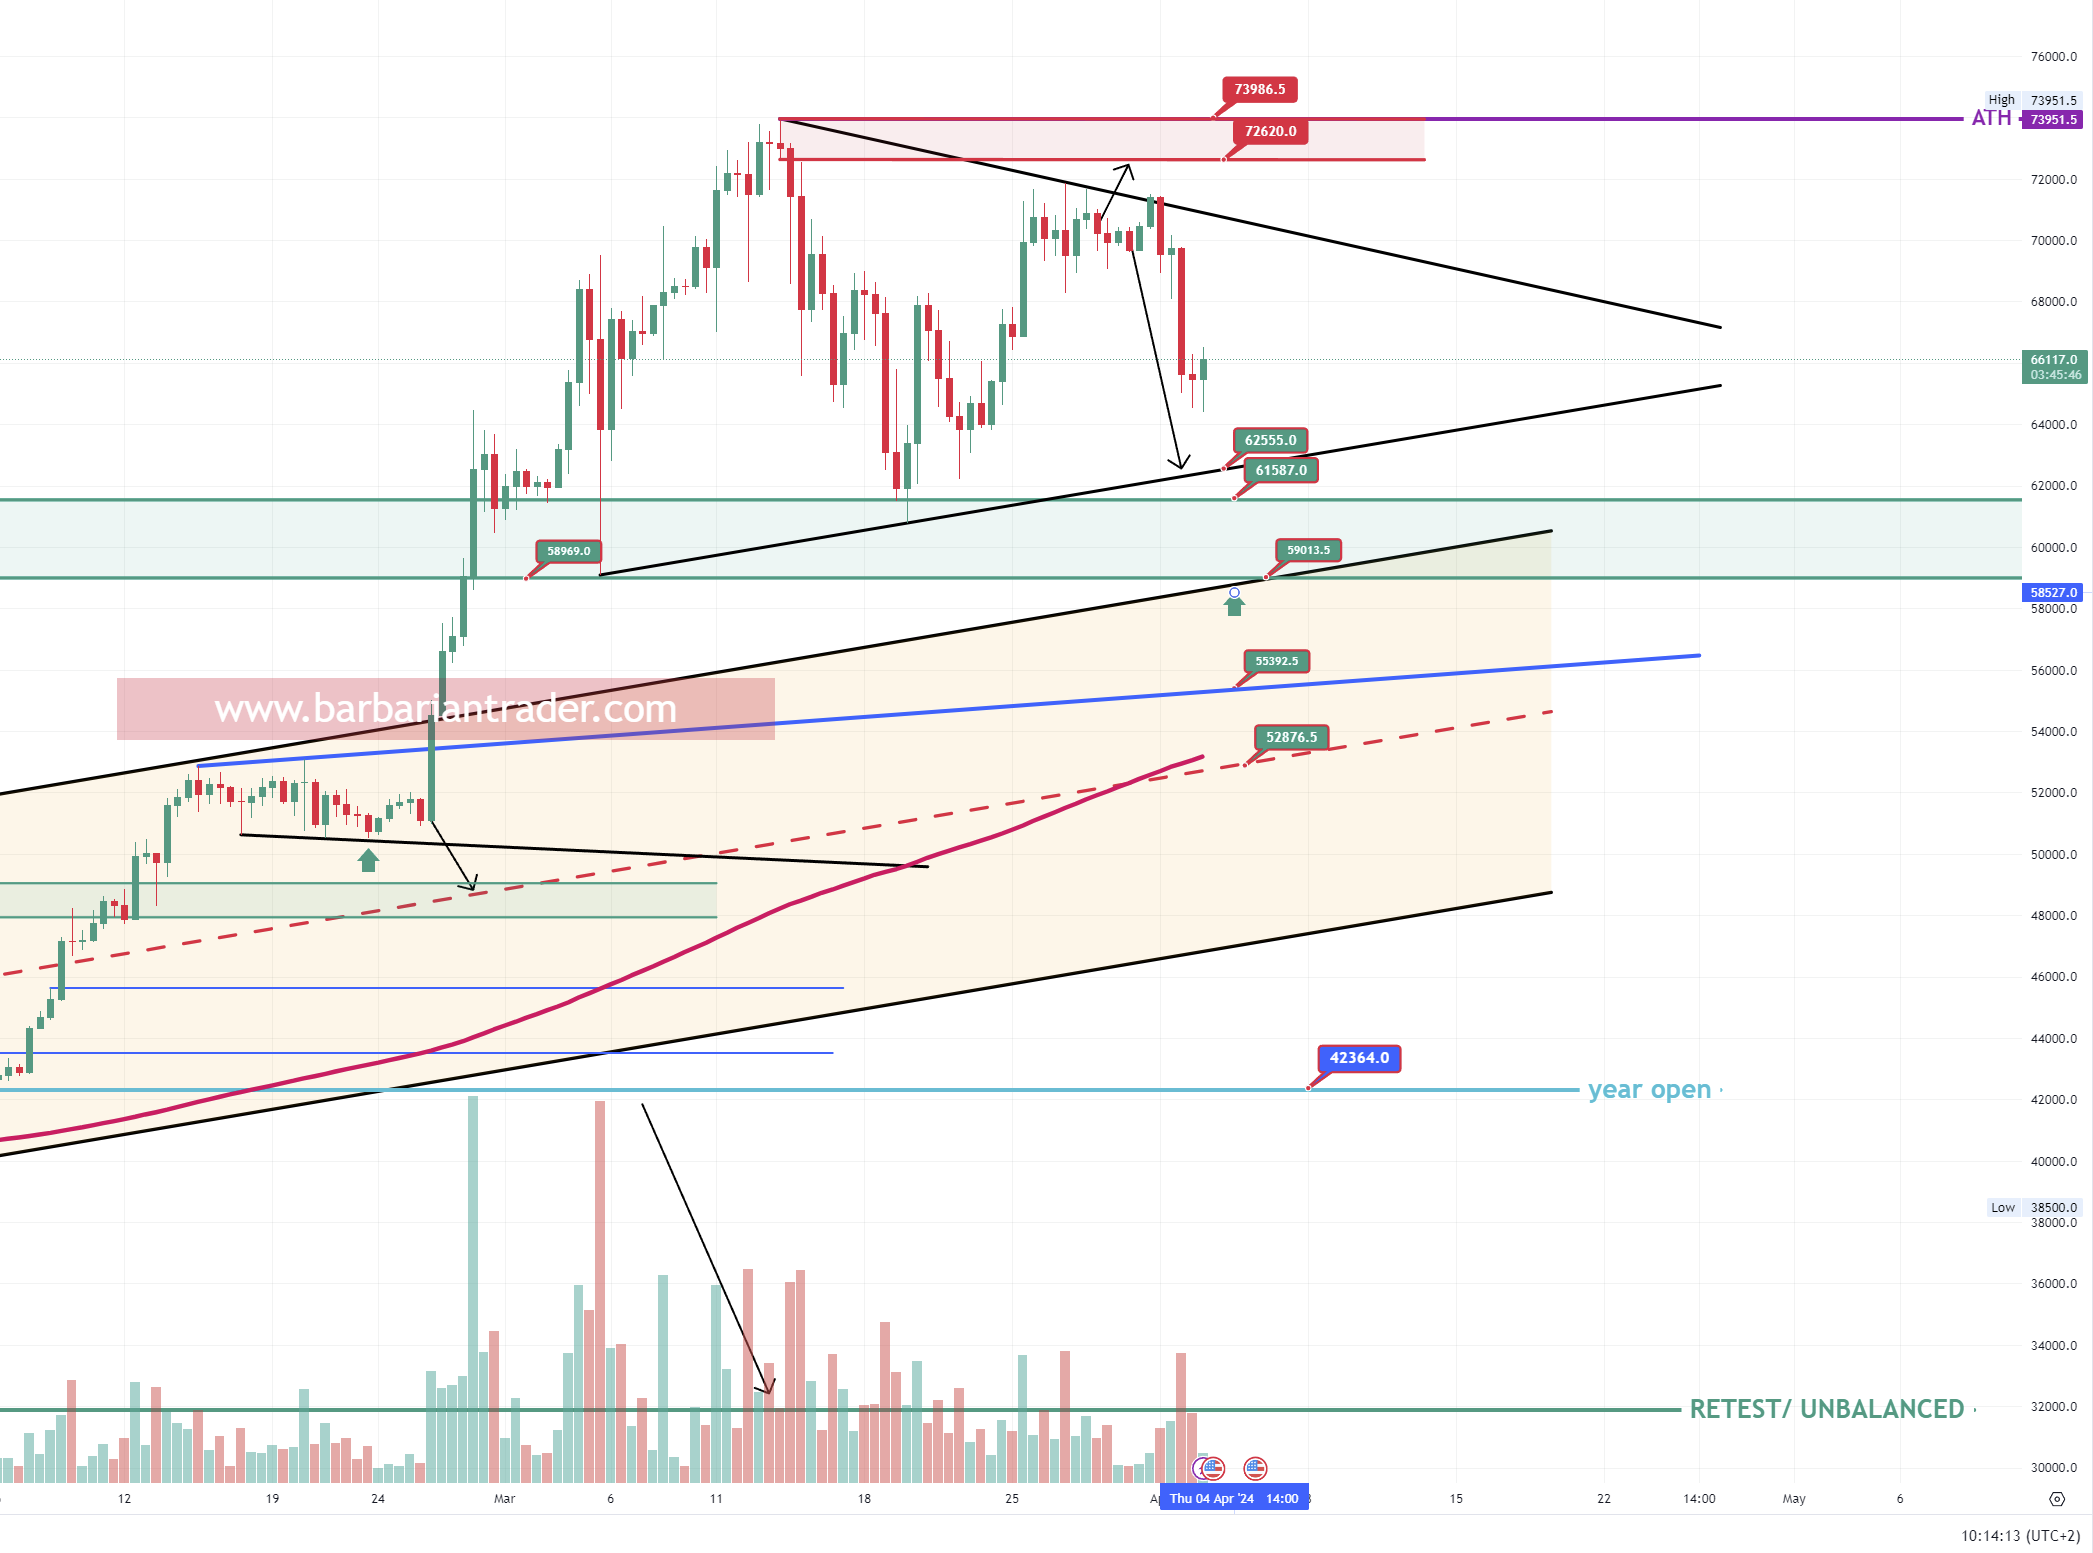
BTC 12h chart (BYBIT)
After a second rejection from the previous ATH (69182), Bitcoin price is trading inside a symmetrical triangle.
For now, we need to keep an eye on the key support level of 62500 (bottom of the triangle) and 68000 (diagonal resistance).
Usually, inside a symmetrical channel, we have a good amount of time for choppiness until the triangle is broken in one direction or another.
I am looking for a possible short trade with entry at the above diagonal resistance. For a long trade, I am looking for a reaction of the lower key support market in the chart.
In case the triangle ends up with a bullish output, we might see the 77700 level targeted. If the bears will get in control, we should keep an eye for a reaction of the 59000 level and the lower levels of support.
Note: Check your broker chart and see the price level difference. This is just my opinion and it is not meant to be a signal or financial advice. Trade safe and manage your risk.
I hope you enjoyed this article. Don't forget to follow me on Twitter, YouTube and Instagram.
JOIN our Discord VIP trading group and get access to a lot of LIVE TRADING CHARTS: https://www.patreon.com/barbariantrader