
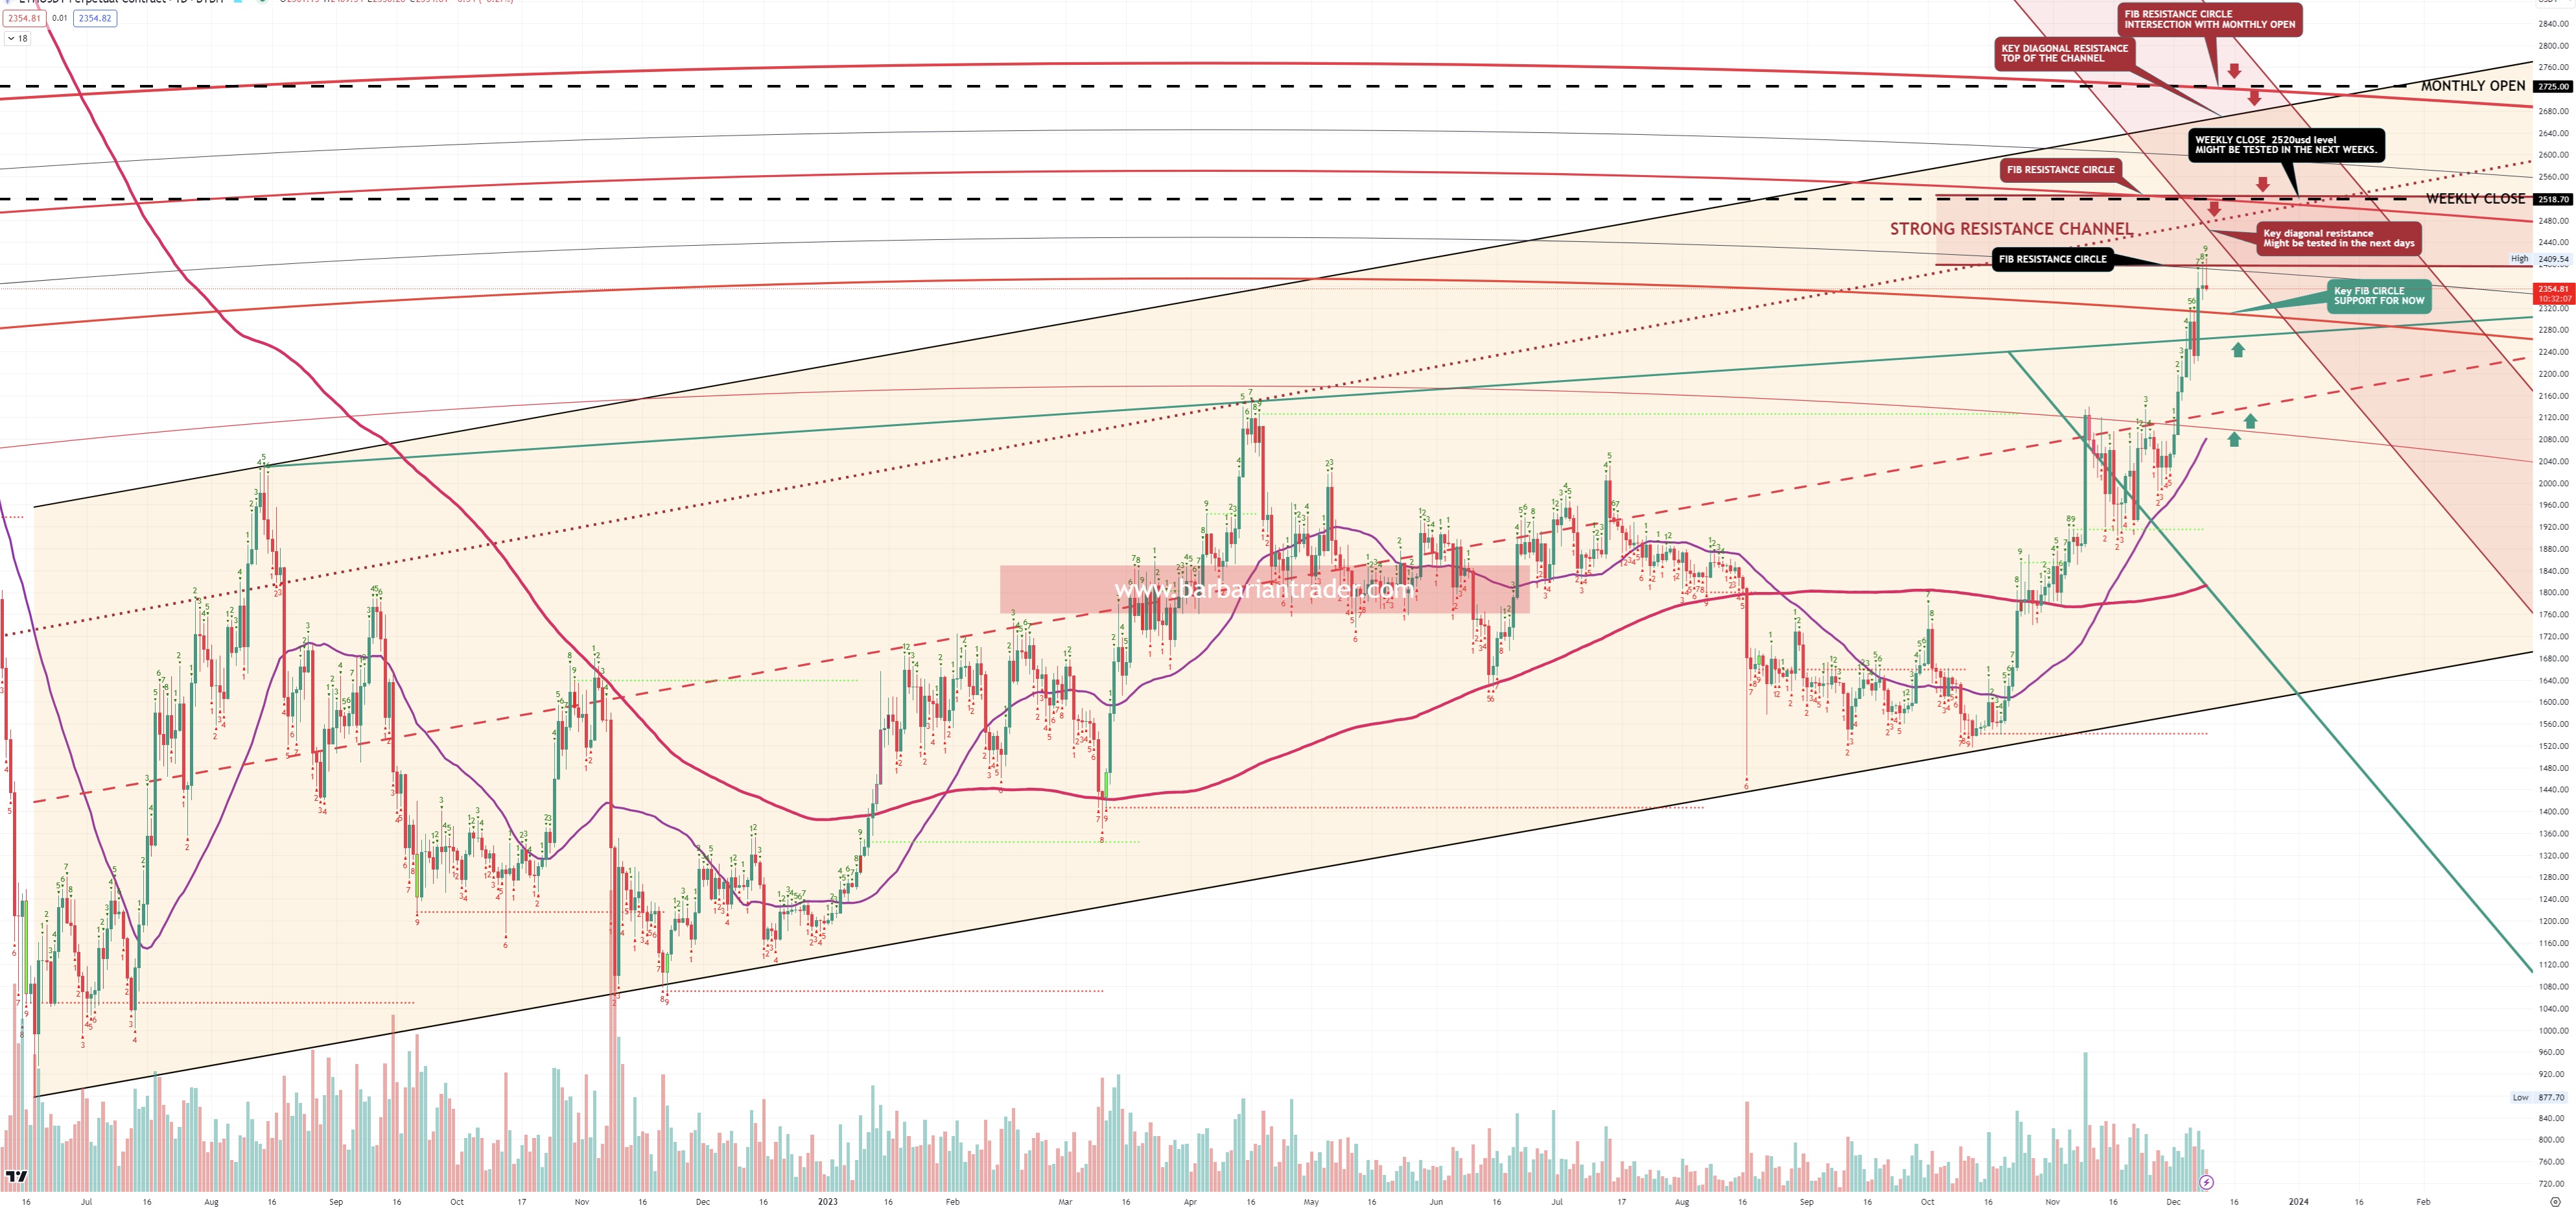
ETHEREUM Daily chart
After a strong and profitable rally up, Ethereum price hit two levels of strong resistance, 2312 and 2400, the last one giving for the moment a strong rejection.
Lets analyze what we can expect in the next days.
For now, TD Sequential painted the current Daily candle with number 9, indicating a possible reversal from here. As well, depends how the daily candle will close, we might end up with a red shooting star candle that is a bearish indicator as well.
A possible scenario might be, a dump to test the bellow red diagonal of support, 2312 level, a bounce from here and possible one more small move up into the red falling diagonal of resistance, currently at 2460. In my opinion, this diagonal will give a good rejection and will create a good opportunity for another short scalp.
Just above we have multiple resistance, dotted red diagonal of resistance, past weekly close and on the exact level we have the next key fib. circle of resistance (2520usd area)
In my opinion, from this level of 2345 and up, worth building a swing short position with the take profit in 2300 and possible lower into 2100-2200 zone.
From bullish perspective, in order to see a possible Ethereum price in the 2650-2730, bulls must break and hold as support the 2530 level.
Trade safe and manage your risk
I hope you enjoyed this article. Don't forget to follow me on Twitter, YouTube and Instagram.
JOIN our Discord VIP trading group and get acces to a lot of LIVE TRADING CHARTS: https://www.patreon.com/barbariantrader