
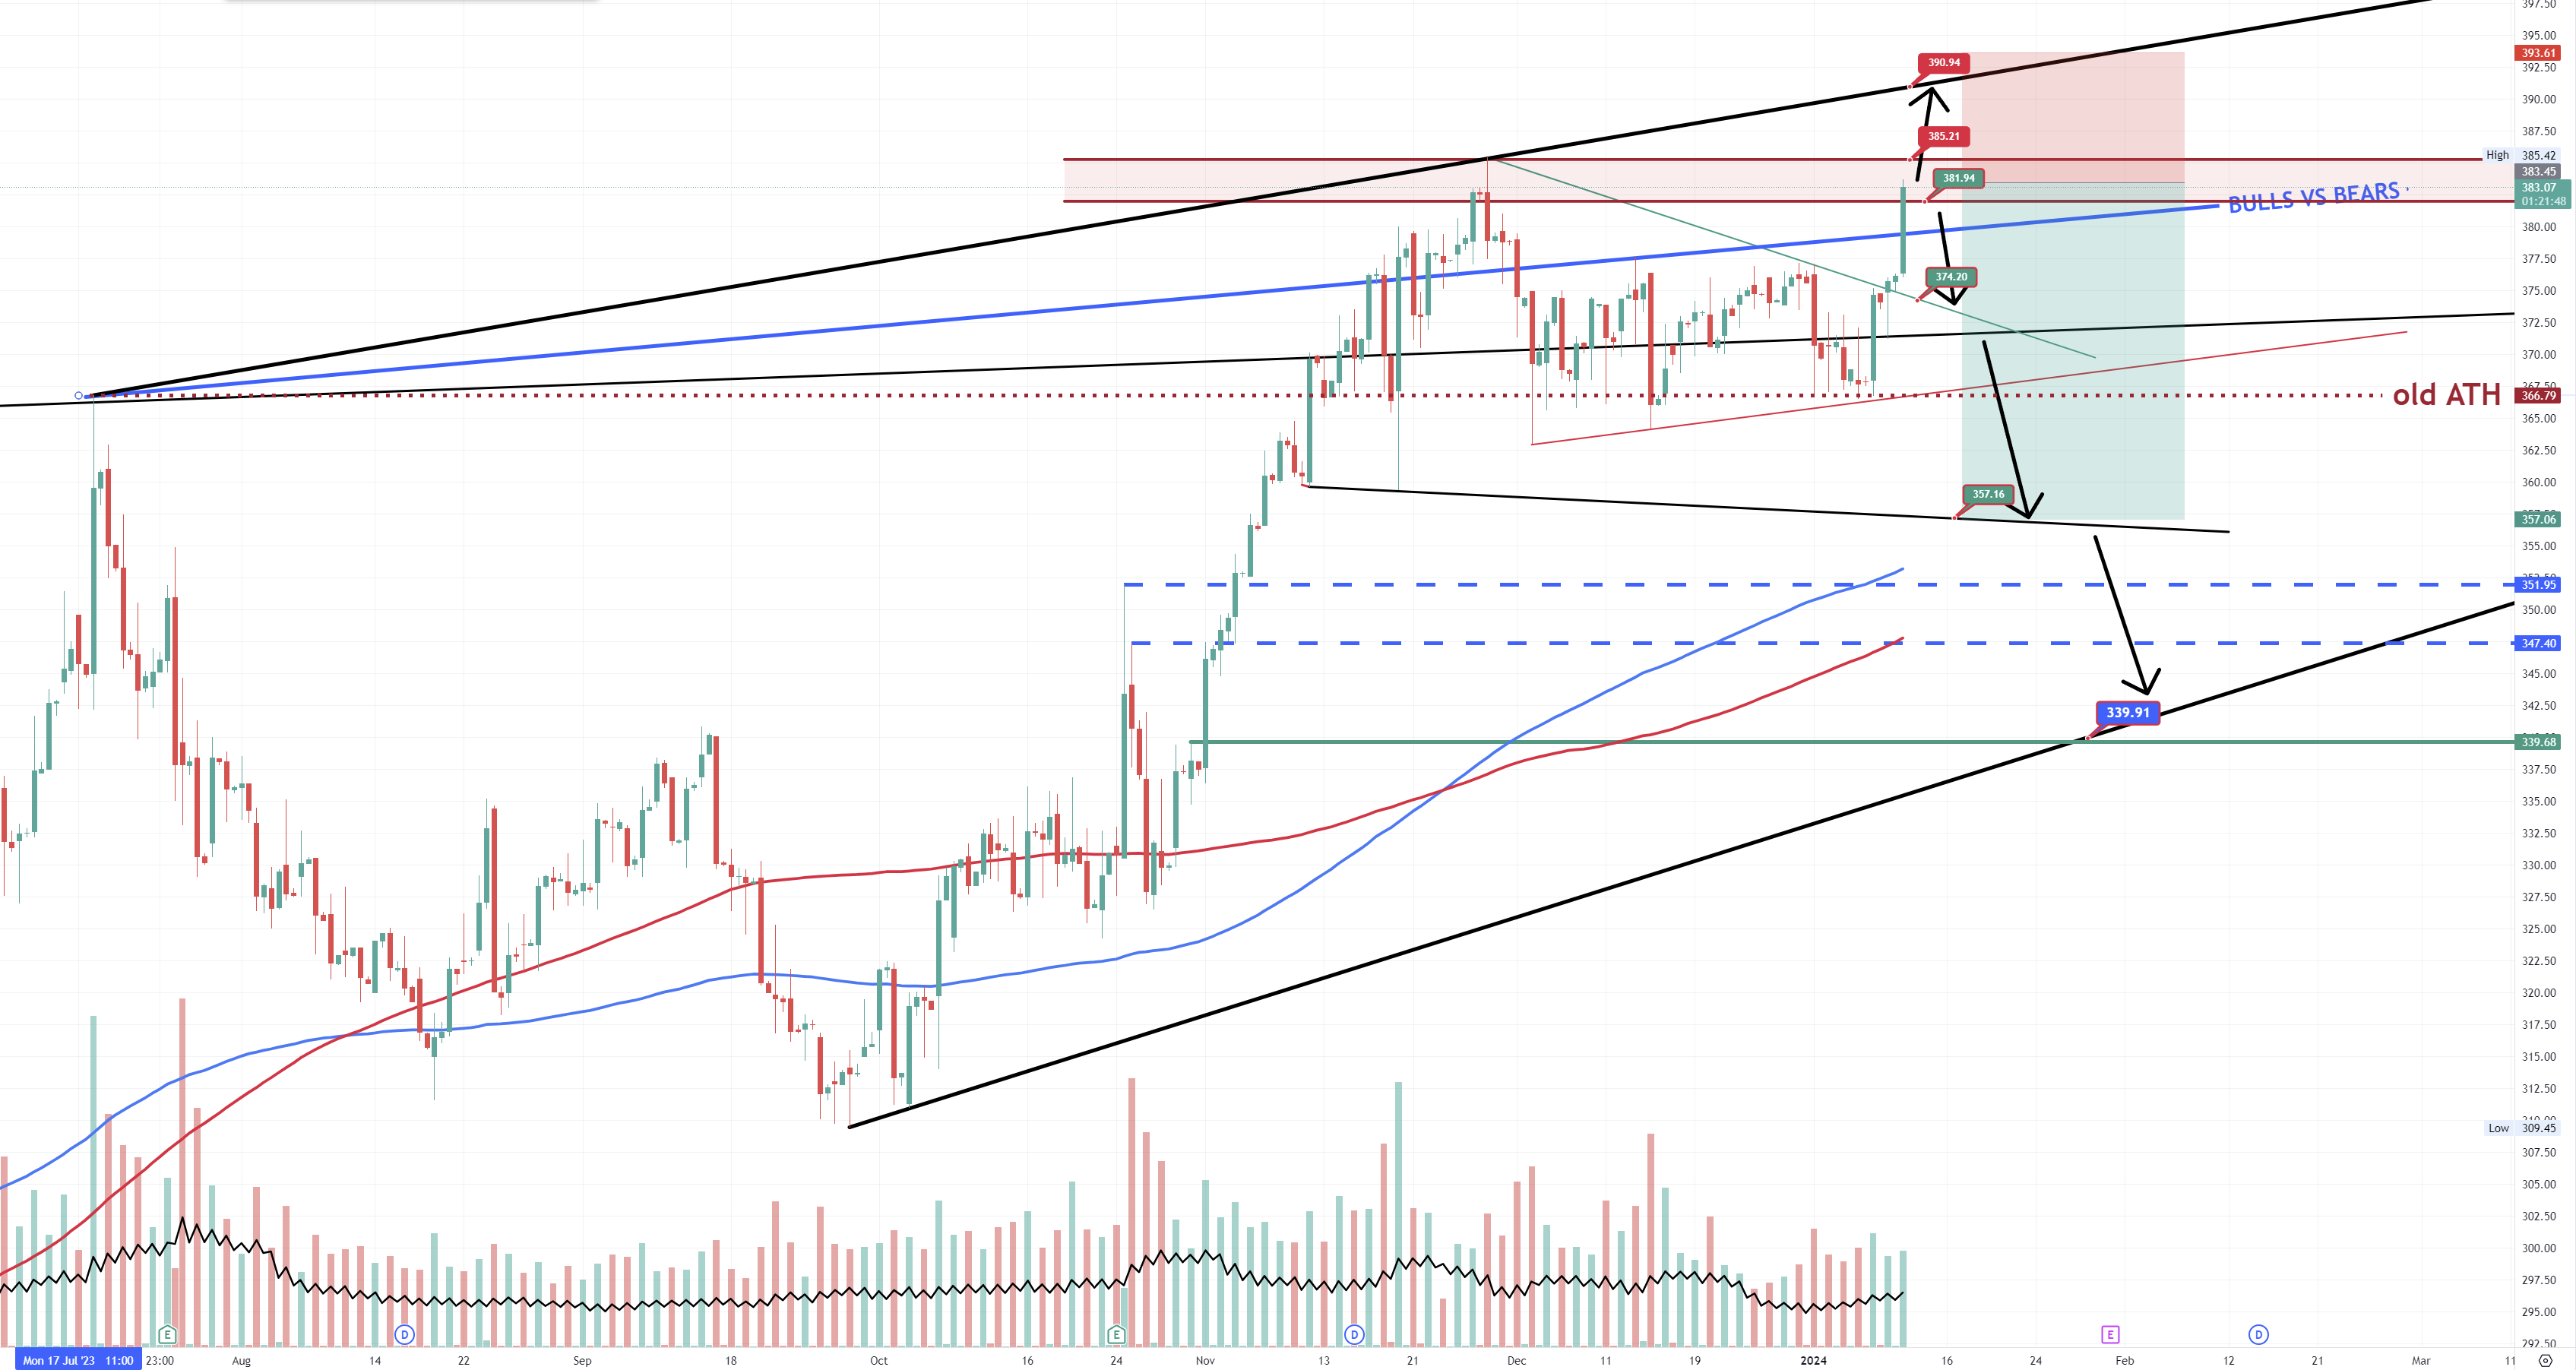
MICROSOFT 12h chart
After a break and test of support of 375 level, Microsoft price put a strong rally up into the resistance zone of 381-385.3.
If we zoom out, we can see that we might trade close to the top of a possible rising wedge. Latelly Microsoft is creating a simmilar patter as Bitcoin just before the big dump frm 69k area.
We can not dismiss this theory and we should keep an eye at the blue key diagonal of support, for now (Bulls vs Bears). I have a feeling that once this diagonal is lost as support, and flipped in resistance, we might withness a stronger sell in the next weeks/ months.
For now, not an financial advice, a possible trade, could be a swing short, loading from this level up to the top of the black diagonal of resistance. SL above that. Possible long term target could be 357 level (lower diagonal of support) and even 340 area.
I will do updates in the following days regarding Microsoft price action.
Note: Check your broker chart and see the price level difference. This is just my opinion and it is not meant to be a signal or financial advice. Trade safe and manage your risk.
I hope you enjoyed this article. Don't forget to follow me on Twitter, YouTube and Instagram.
JOIN our Discord VIP trading group and get acces to a lot of LIVE TRADING CHARTS: https://www.patreon.com/barbariantrader