
Nvidia Daily chart
NVIDIA is a leading American multinational technology company known for its expertise in graphics processing units (GPUs). The company was founded in 1993 and has since become a dominant player in the gaming, artificial intelligence, and data center markets.
Over the last 12 months, Nvidia stock is up more than 300%, and over the past five years, the company's shares are up more than 650%.
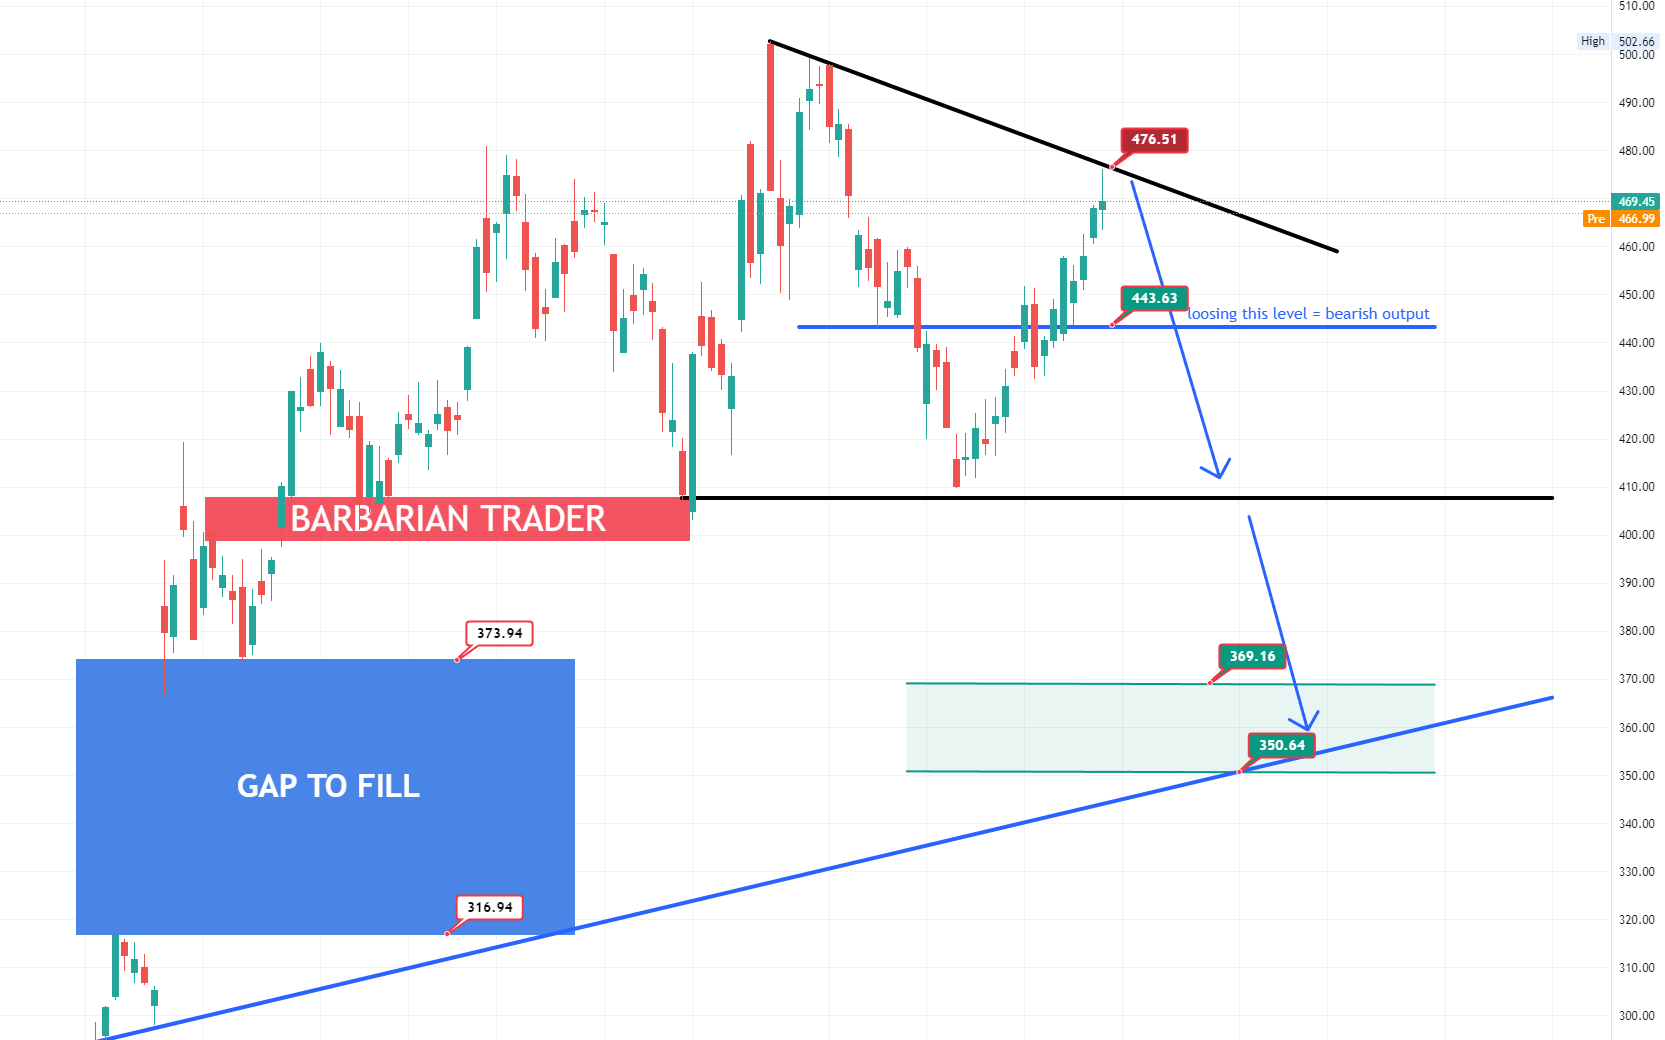
In the last weeks, after a strong rally, Nvidia price painted a descending triangle, and right now the price got a decent rejection from the top of it. If the 476 level continues to act as resistance, we might see a fall in Nvidia price down to .443.63. In order for the trend to remain bullish, bulls must hold the 443.6 level as support and target the local high.
Losing the 443.6 level and flipping it into resistance, bears might get in control and might attempt a push into 410 level (base of the descending triangle). once that base is broken and the triangle is confirmed, bulls might push the price much lower targetting the 350-370 area of support.
Keep in mind that the huge gap from 317-374 has not been closed. Sooner or later, we will see Nvidia price dipping below the gap.
The fall of Nvidia might pull down as well US100.
Possible SHORT swing trade:
Entries: 460-490, TP1 458, TP2 444, TP3 421, TP4 390, TP5 370. SL: 506
Trade safe and manage your risk.
If you want to see this chart LIVE and other charts as well, join our Discord VIP trading group: https://www.patreon.com/barbariantrader