
S&P 500 (US500) Daily chart
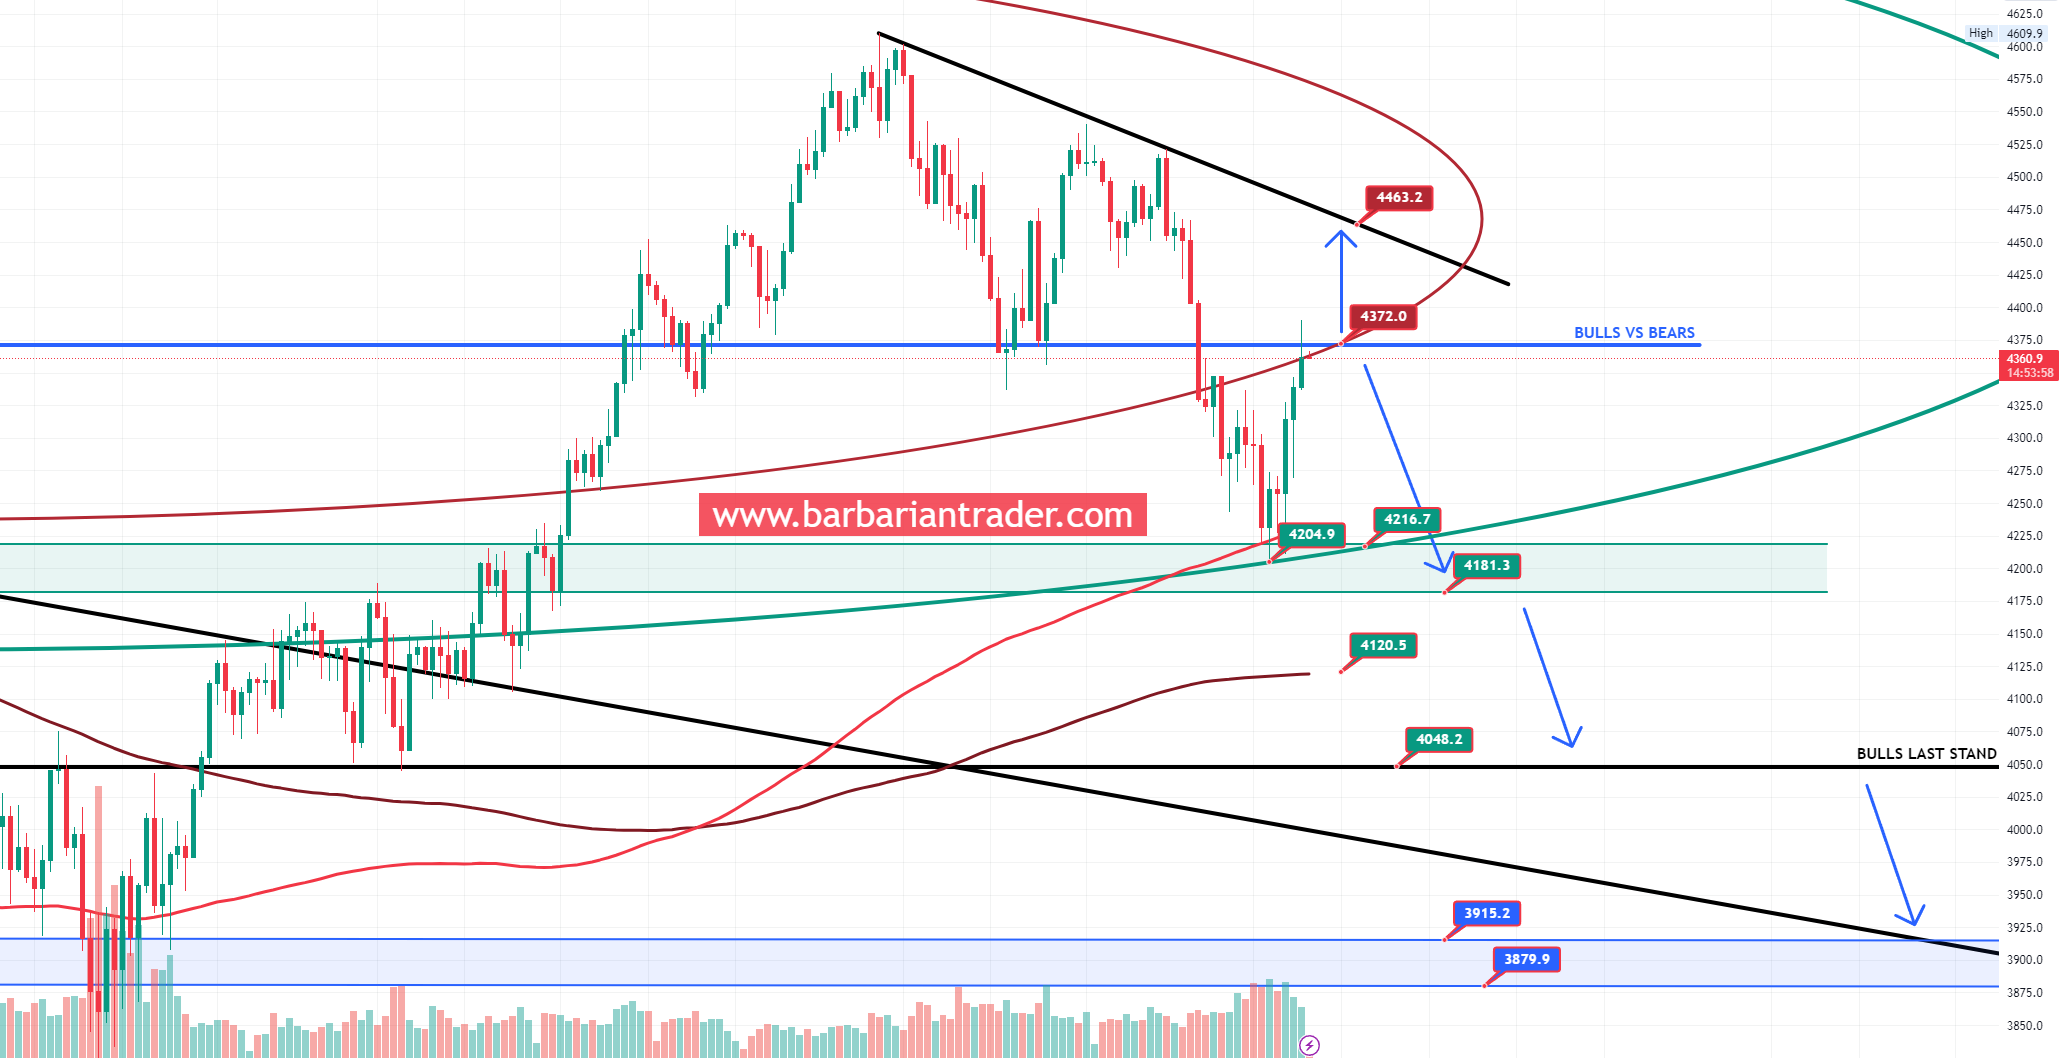
After the S&P 500 found support at the 200MA and the green fib. circle, we saw a strong bounce into the key resistance area 4372.
This horizontal level was disputed in the past, acting as resistance or support. The S&P 500 price might see a correction after this rally.
If the bulls manage to push the price above the 4372 level of resistance, we might see an attempt at the 4460 level (diagonal of resistance)
As long as the S/P500 trades and remains above 200MA, the trend remains bullish. Once the bulls lose the 4181 level, the bears might get in control and we might see an attempt for the price to fall into the 4048 level and even lower along the descending diagonal of support.
Possible trade: SWING short:
Entries: 4360-4465. SL: 4555. TP: 4325, 4300, 4220, 4125
Trade safe and manage your risk.
If you want to see this chart LIVE and other charts as well, join our Discord VIP trading group: https://www.patreon.com/barbariantrader