
SOLANA-USDT 4h Bybit chart
Starting from 23th of September 2023, SOLANA price managed to pump a whopping 550%, making a lot of traders who missed the train to regret selling SOLANA on lower levels.
Now, after such a strong and profitable rally, the question traders and investors asked themself is, for how long the price will continue the rally up and what are the key levels to sell and buy.
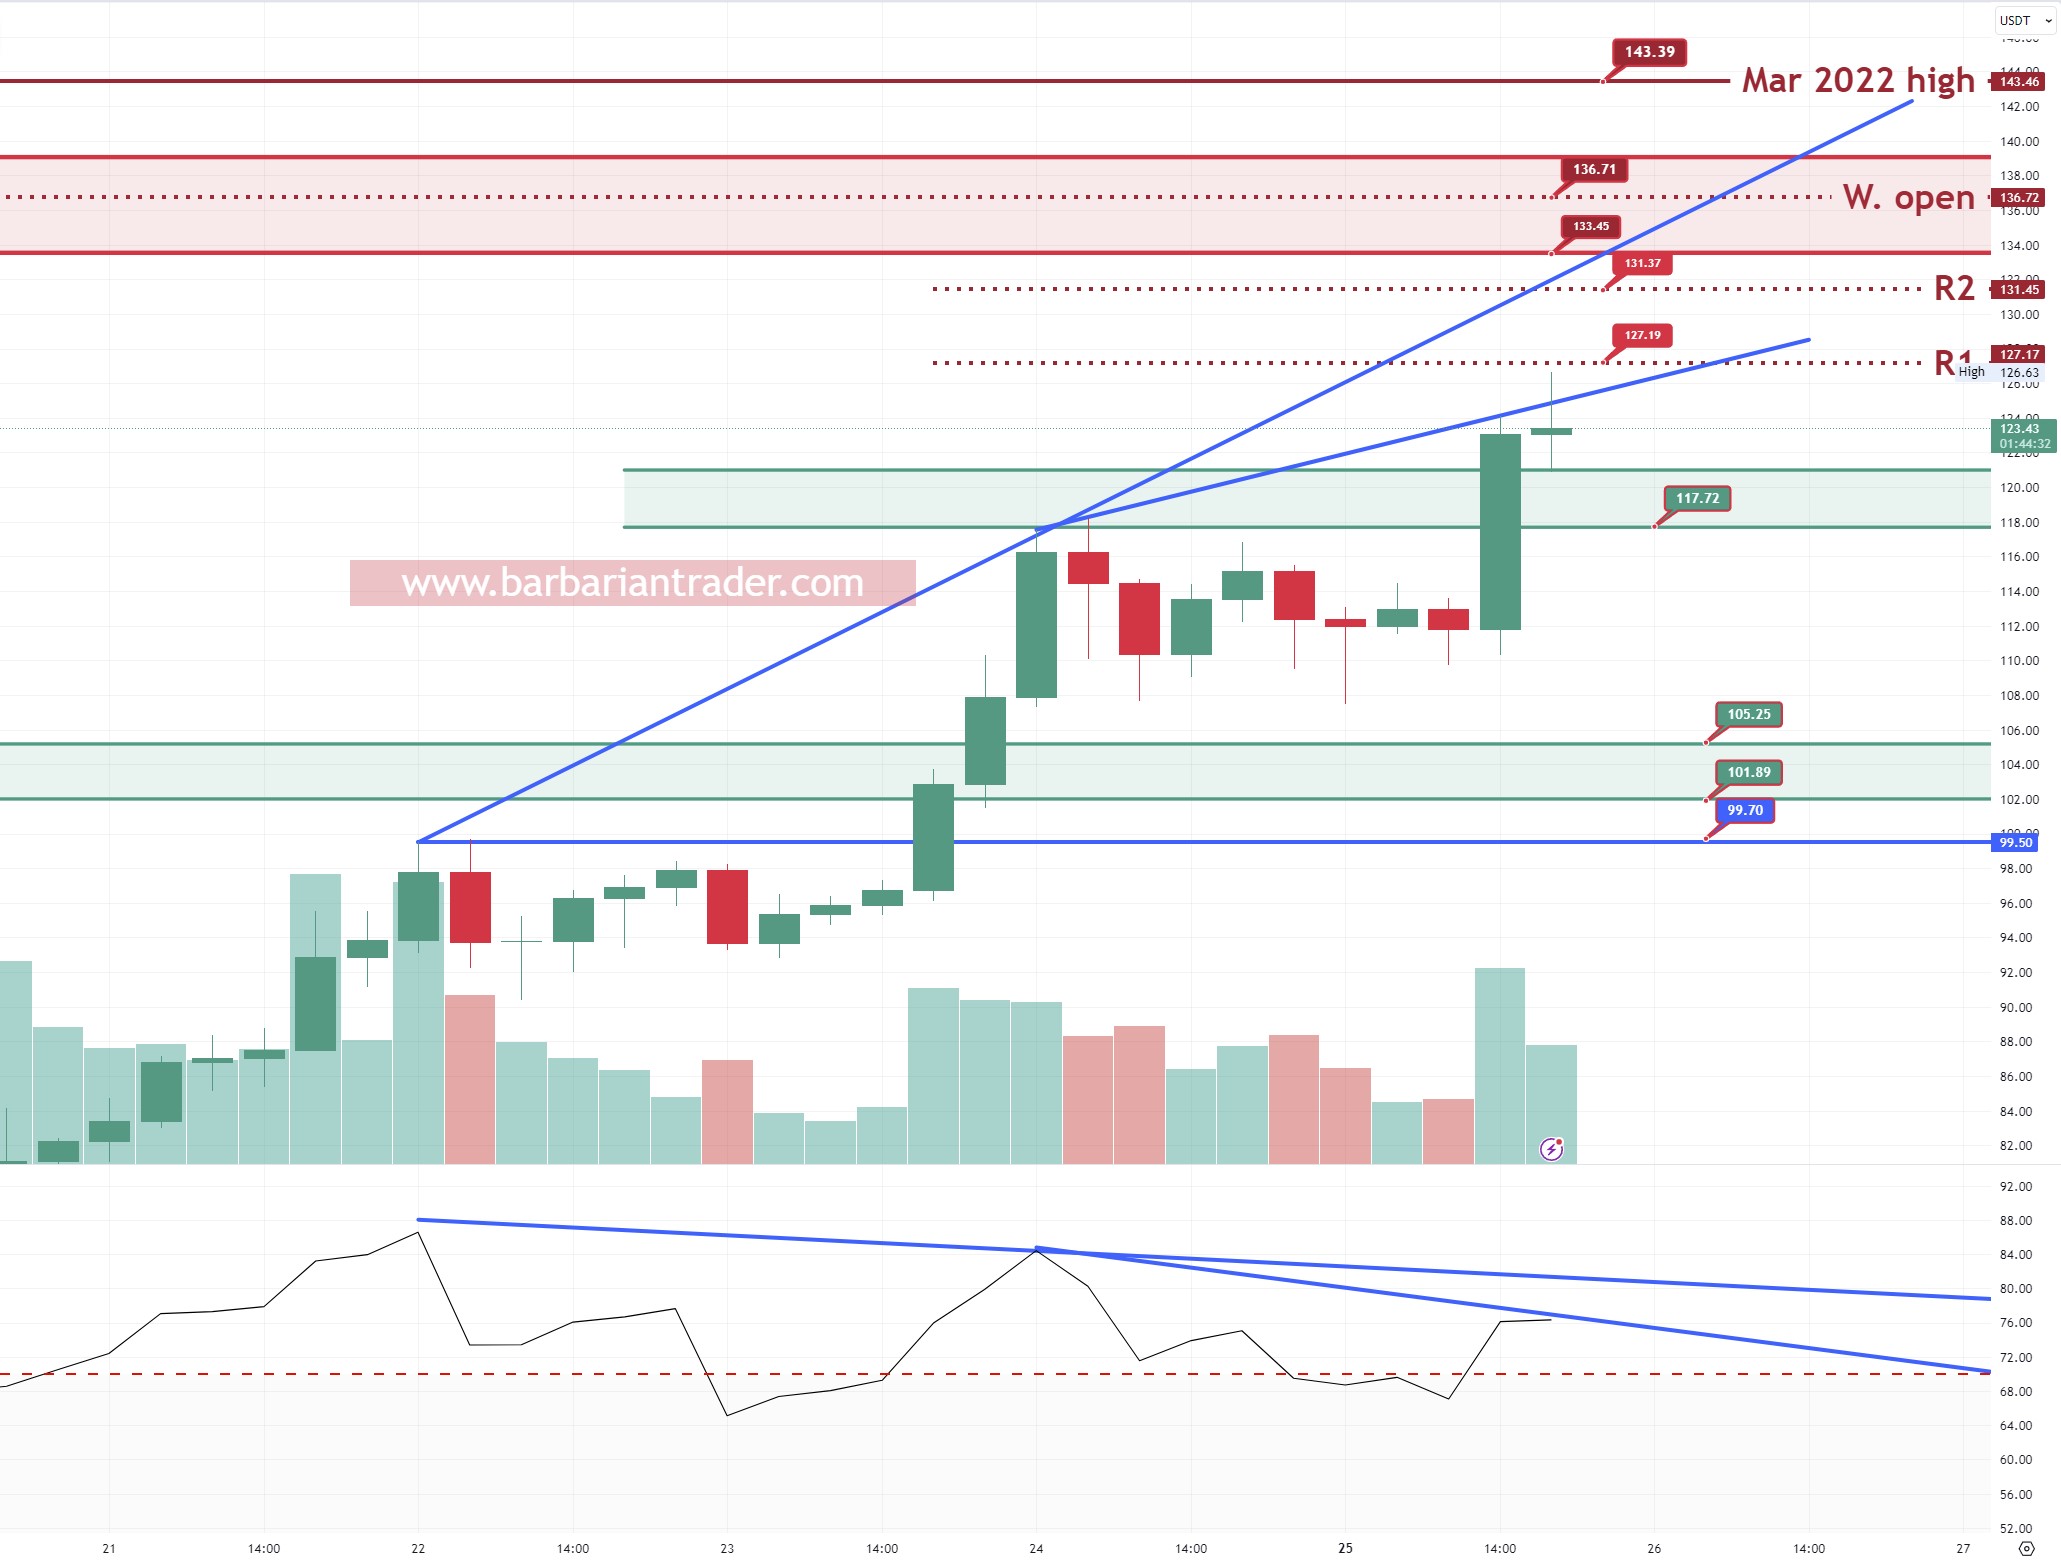
For now, on 4h, the RSI painted a Bearish divergence and soon we might see a possible stronger sell.
As long as 117-121 is acting as support, bulls still have a chance to push the price into the upper resistance levels. The strongest resistance is the area of 133-137. At 136.71 we have the Weekly open and above at 143.46 we have the Mar 2022 high.
A healthy move, from this level of 123.4, will be to have a small correctin and then a possible continuation up into the above mentioned levels.
Keep in mind, usually after such a strong rallies like that, corrections/ sell-off could be very strong and violent. i dont exclude a possible dump under the 100usd level.
The 4h 200 SMA (red) it is at 72 currently, so keep you mind open for any possible action from the current level.
A possible trade, could be a swing short trade starting from this level of 123, with asks up to 145 and TP below 105. (not a trading or financial advice)
Trade safe and manage your risk
I hope you enjoyed this article. Don't forget to follow me on Twitter, YouTube and Instagram.
JOIN our Discord VIP trading group and get acces to a lot of LIVE TRADING CHARTS: https://www.patreon.com/barbariantrader