
NAS100 Daily chart
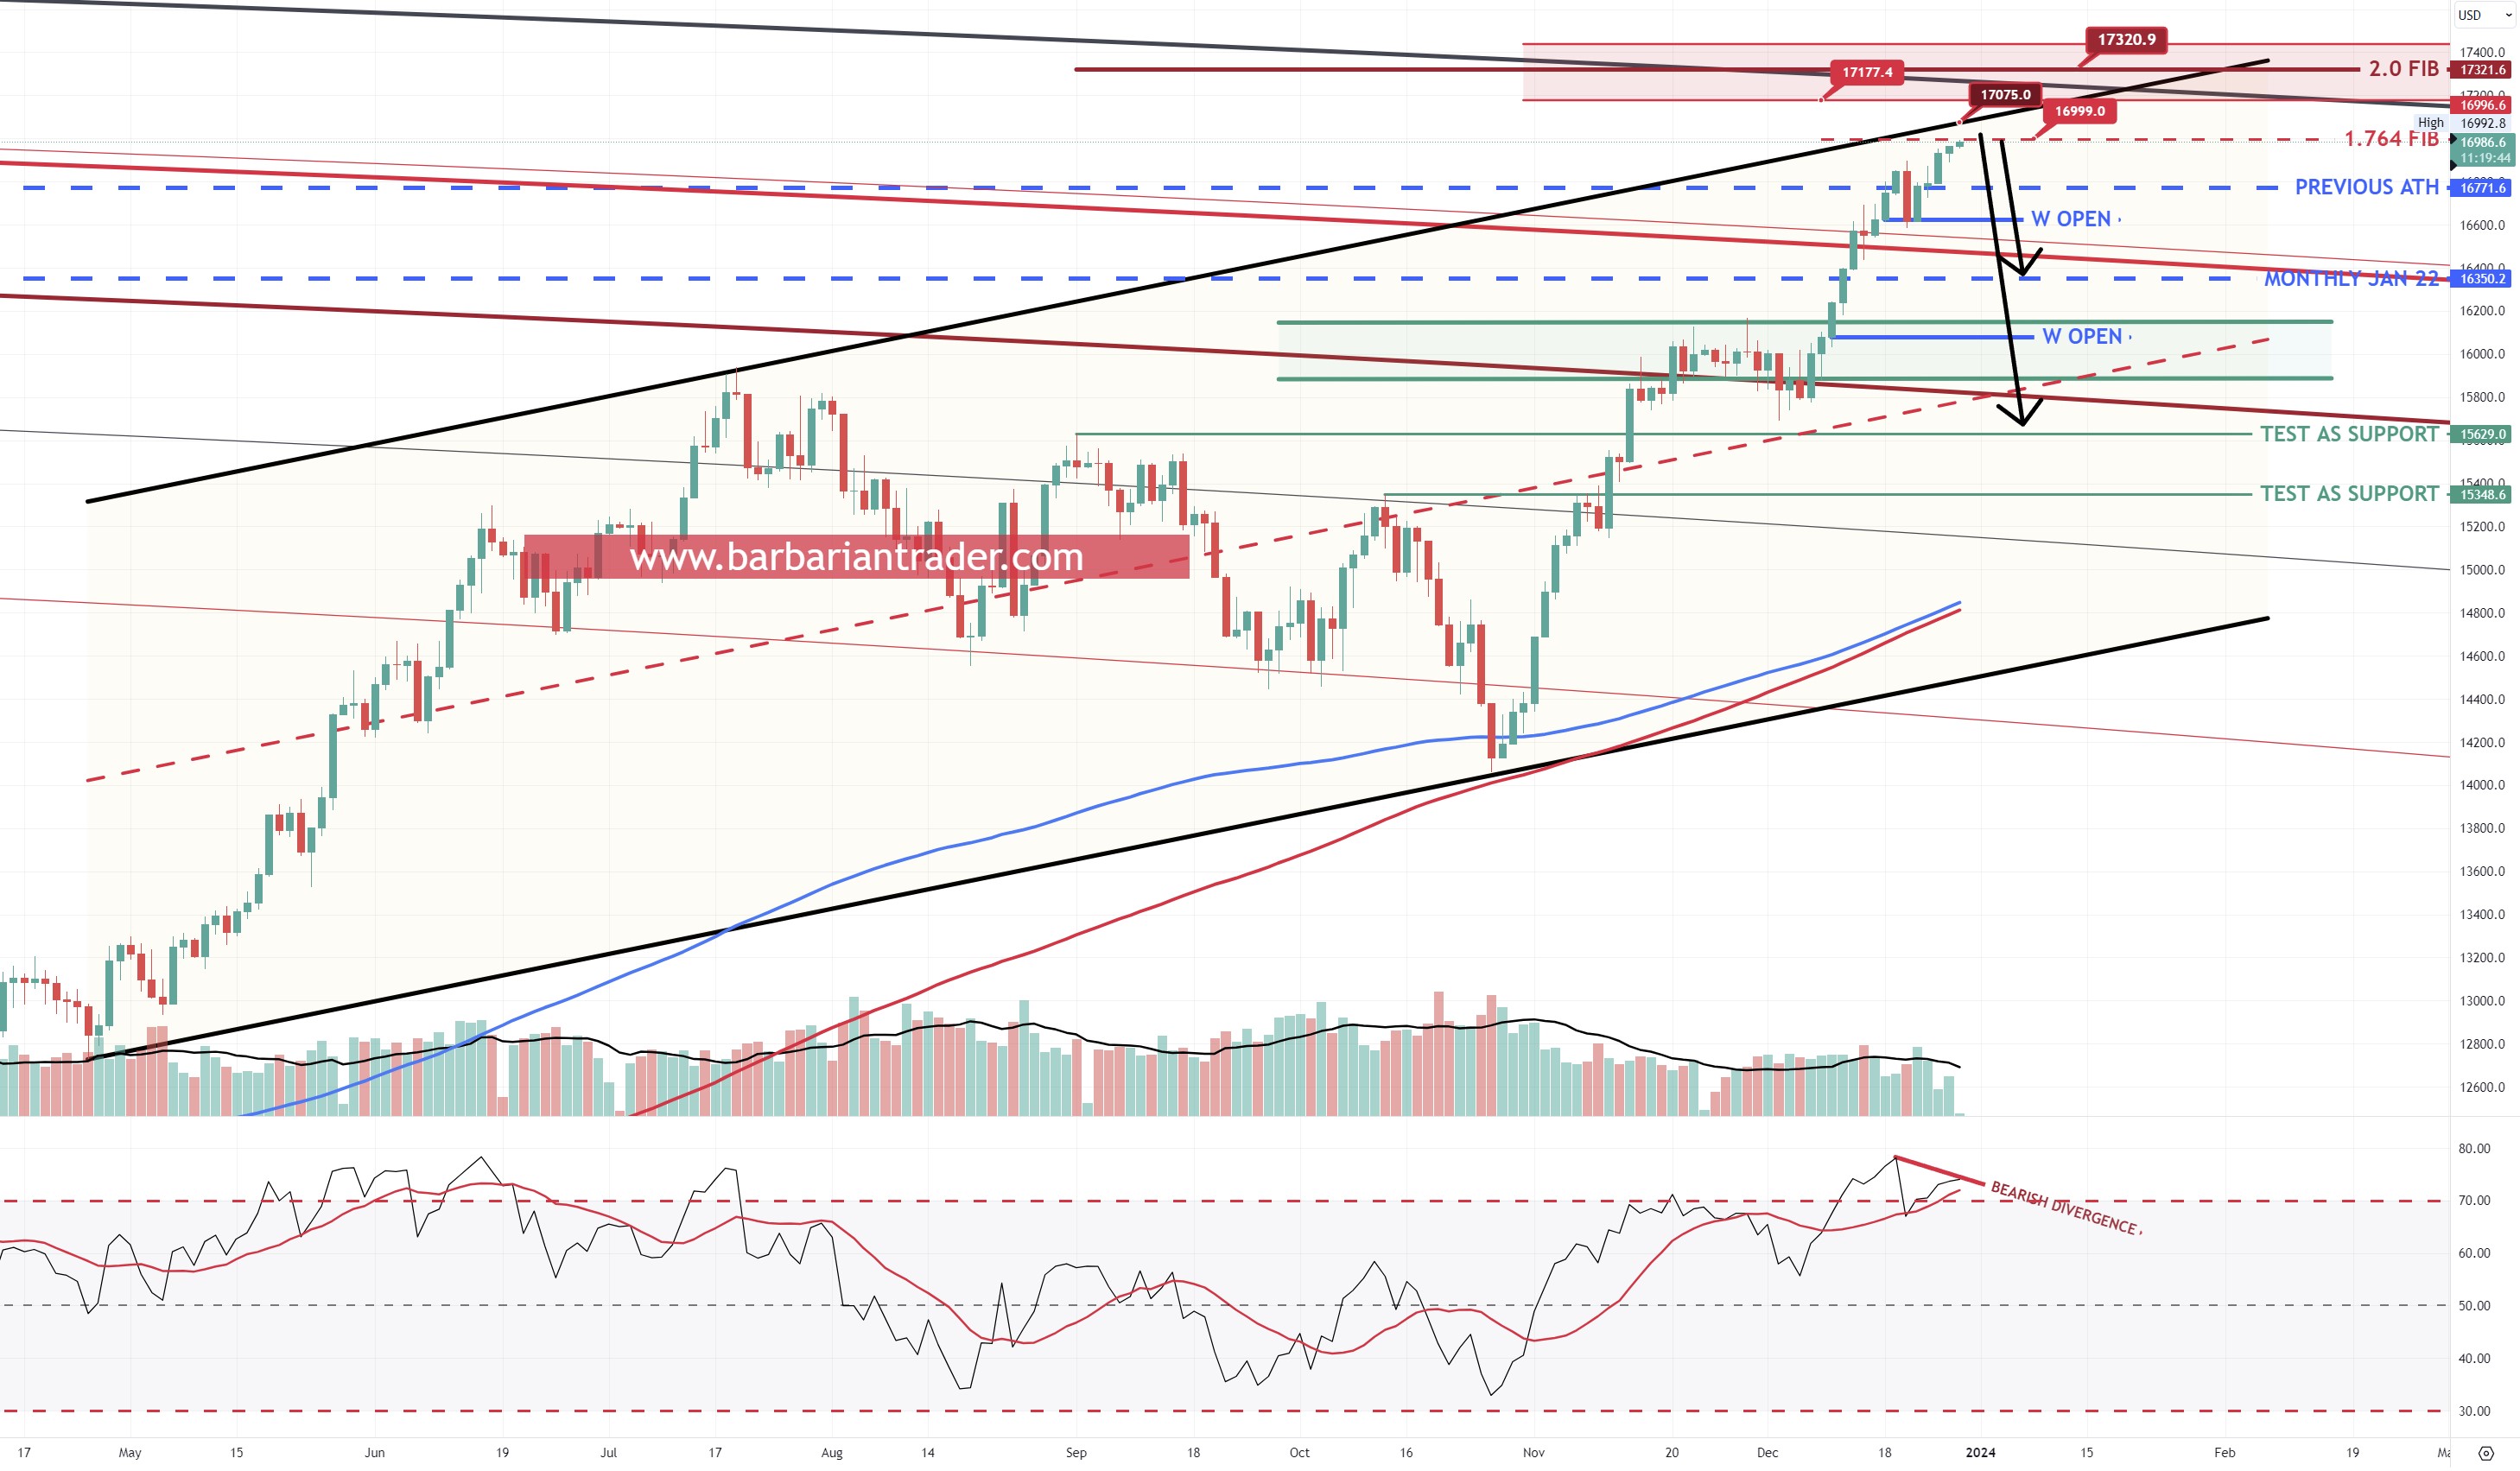
The US100 Santa rally continues and the US100 price is facing multiple resistance zones starting from the technical and psychological level of 17.000 above and continuing with the top of the bearish flag at 17075. Above that, in case of strong buying pressure, we have the horizontal channel of resistance 17177-17445.
For now, the US100 price is testing as resistance to the 1.764fib level at 16992.
Considering that tomorrow, Friday 29th of December, the Monthly and Year candles will close, we can expect a possible strong volatility.
From the macro perspective, the US100 price is trading inside and close to the top of the big bearish flag. If the top of it will give a strong rejection, we should keep an eye on the next weeks at the median of the flag (red dotted line).
A trade that I am building now:
SWING SHORT:
Entries: 16970-17440.
TP1: 16800
TP2: 16650
TP3: 16180
TP4: 15700
SL: 17520
Note: Check your broker chart and see the price level difference. This is just my opinion and it is not meant to be a signal or financial advice. Trade safe and manage your risk.
I hope you enjoyed this article. Don't forget to follow me on Twitter, YouTube and Instagram.
JOIN our Discord VIP trading group and get acces to a lot of LIVE TRADING CHARTS: https://www.patreon.com/barbariantrader