
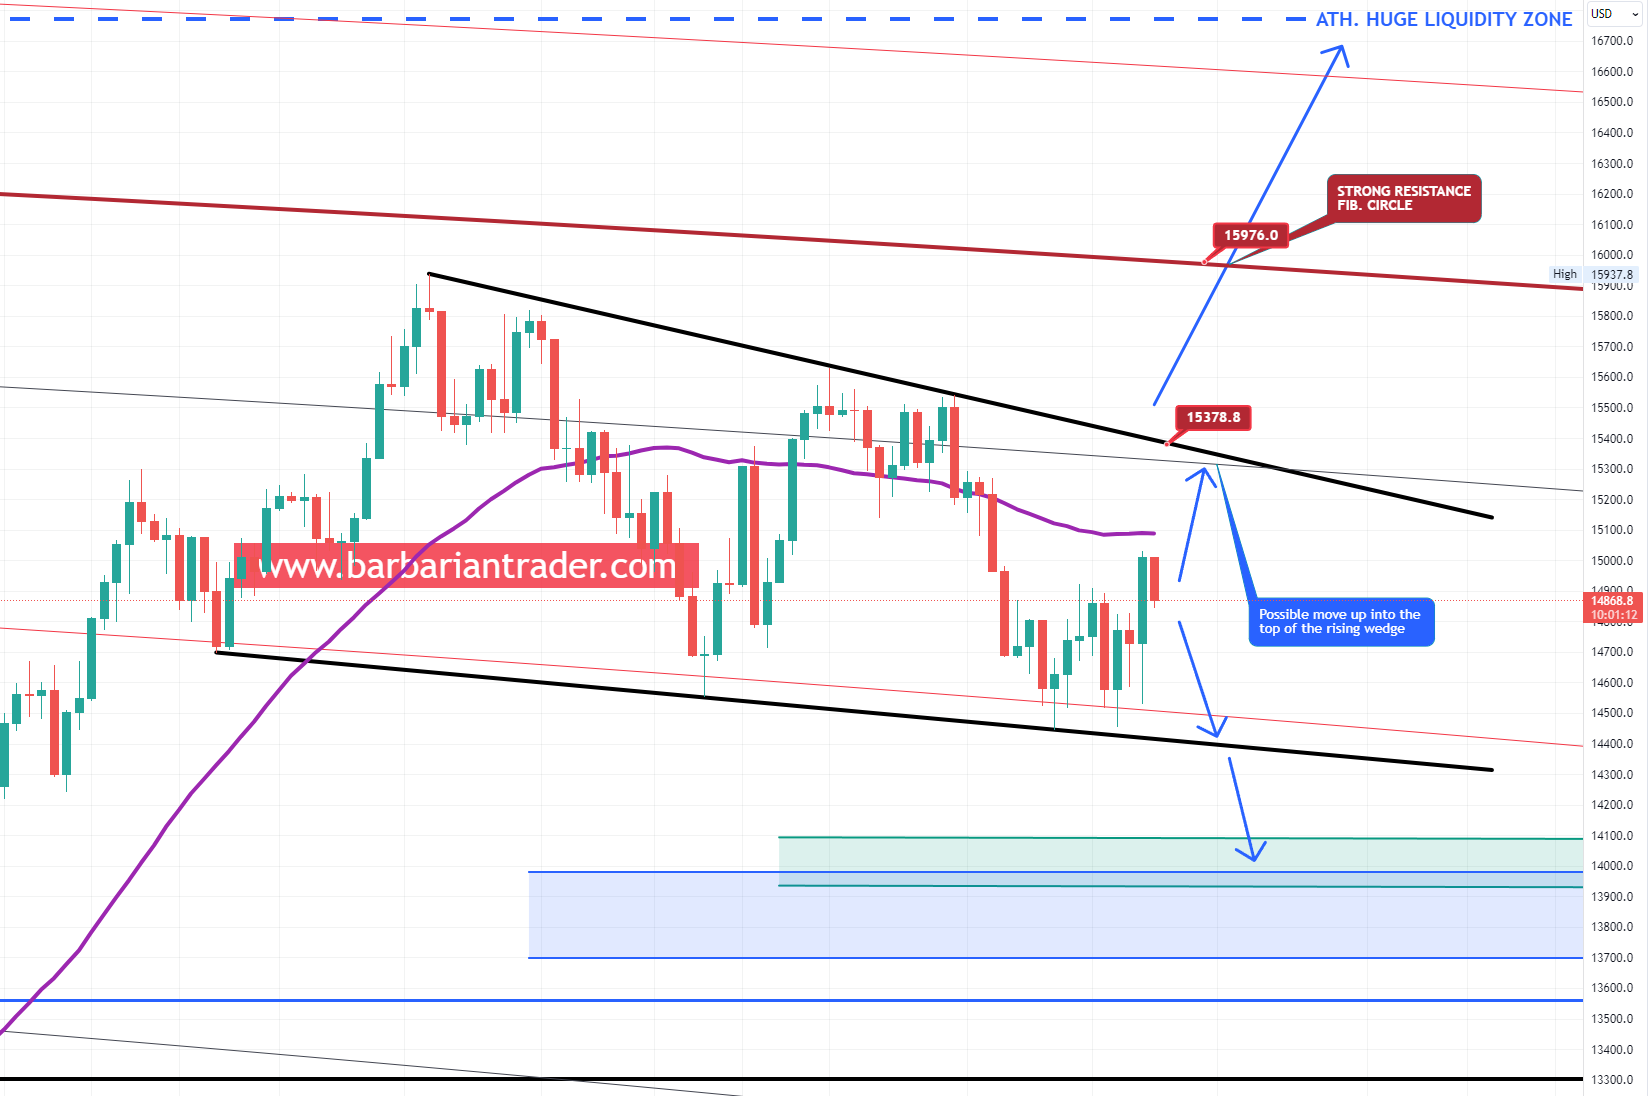
US100 Daily chart. Keep in mind that US100 prices can differ from broker to broker.
After a second retest as support of the bottom of the falling wedge (14400 area), the US100 had a good bounce.
Considering the tragic events that happened on the weekend in Israel, we might see this week strong volatility in the markets.
For, the US100 price is trading under 34MA Daily and is testing a key support area of 14868. If will manage to hold this area of support we might see a continuation with a chance for the bulls to push the price to the top of the falling wedge in the 15350-15373 area.
From a macro perspective, as long as the price is trading inside the falling wedge, US100 can present a good opportunity for a long position with targets into the top of the falling wedge and even above into the key red fib. circle of strong resistance *15976 area)
In the meantime keep an eye at DXY as well. I will post a chart and analysis for DXY as well so stay tuned for more posts.
Trade safe.